![[RELEASE] AVD Health Monitor - Real-time Endpoint Monitoring for Azure Virtual Desktop](/images/avd-health-monitor-header.png)
[RELEASE] AVD Health Monitor - Real-time Endpoint Monitoring for Azure Virtual Desktop
Introduction
If you’ve ever troubleshot AVD connectivity issues, you know the drill: users complain about slow sessions or failed logins, and you’re left checking firewall rules, DNS resolution, and a dozen Microsoft endpoints one by one. I did dig through all of the Microsoft documentation on required endpoints, so you don’t have to.
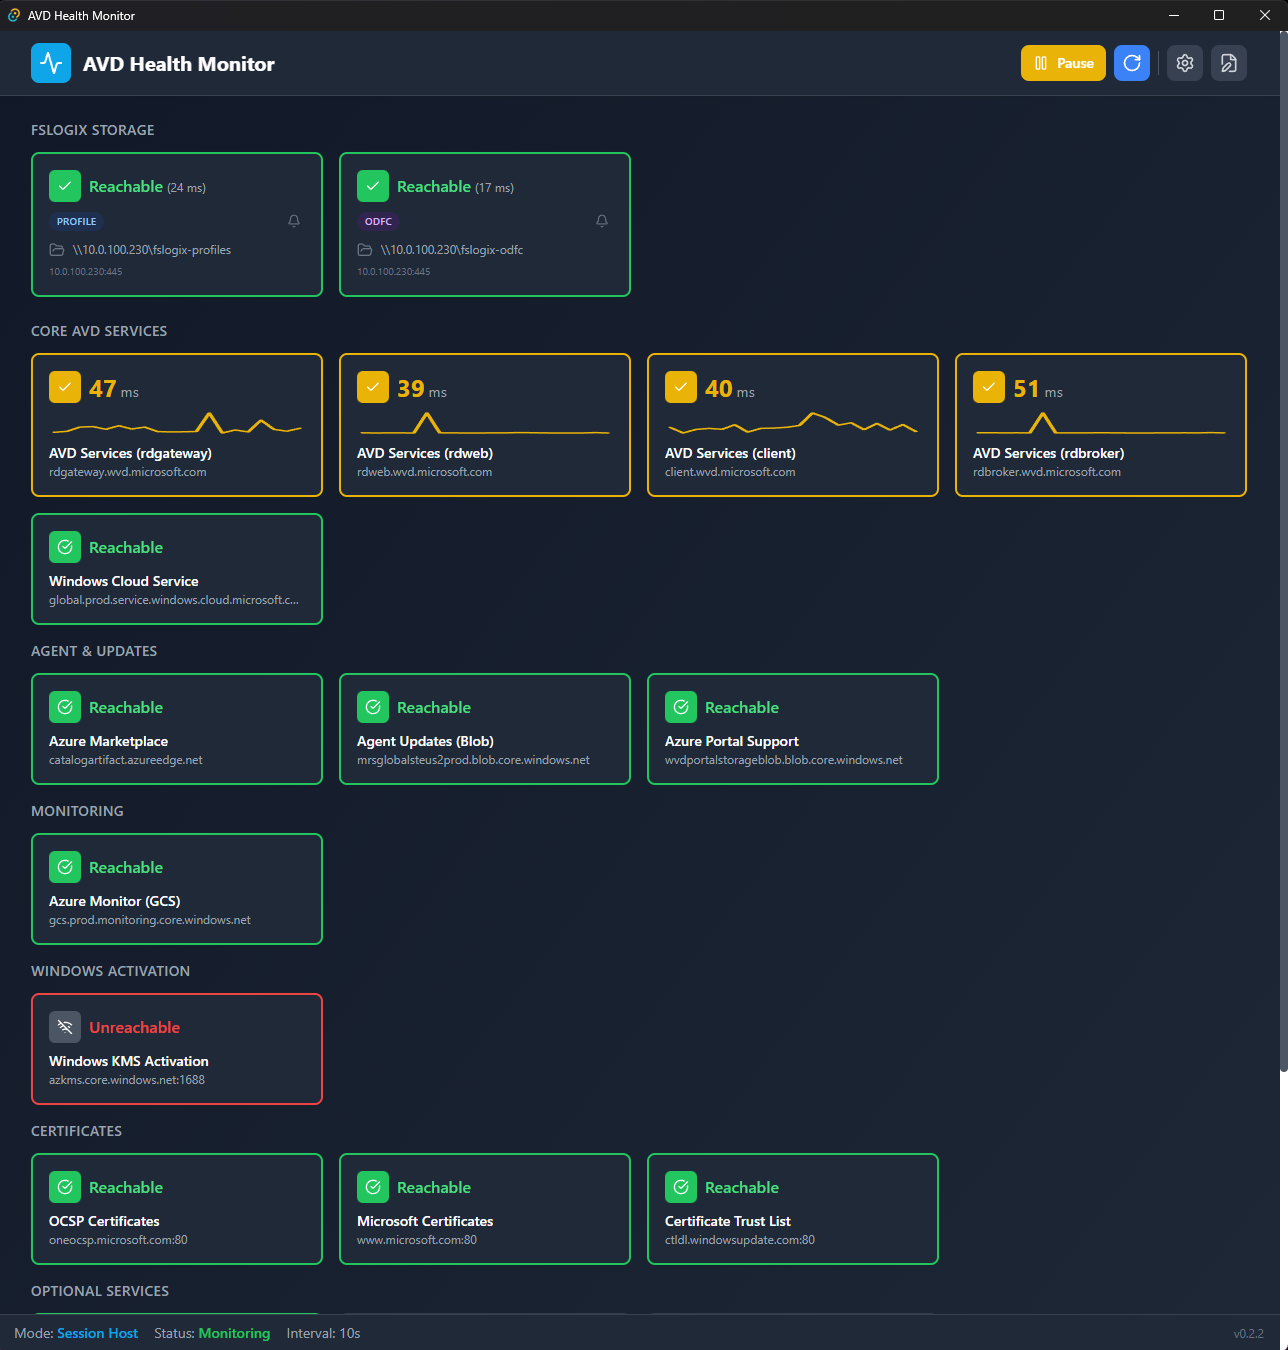
AVD Health Monitor is a Windows system tray application that continuously tests connectivity to all required AVD service endpoints and FSLogix storage paths. It sits in your tray, tests endpoints at configurable intervals, and alerts you when something goes wrong—before your users start calling.
💡 Good to know: The app supports two operation modes—Session Host and End User Device—each with their own set of endpoints. Session hosts need agent communication, activation services, and FSLogix storage. End-user devices primarily need gateway and authentication endpoints.
Why another monitoring tool?
There are plenty of enterprise monitoring solutions out there. But sometimes you need something lightweight that just works:
- No infrastructure required: No agents to deploy, no central server, no database. Just an executable.
- Runs where you need it: On session hosts, client devices, VDI golden images, or your own workstation.
- FSLogix-aware: Automatically detects profile container storage paths from the Windows Registry and monitors their accessibility.
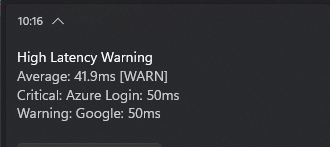
- Immediate feedback: Real-time latency graphs and Windows toast notifications when things break.
This isn’t a replacement for Azure Monitor or your enterprise SIEM. It’s the tool you run when you need to verify connectivity after a firewall change, or when you want continuous monitoring on session hosts without the overhead of a full monitoring stack.
Use Cases
1. Session Host Health Monitoring
Deploy on your AVD session hosts to continuously verify:
- RD Gateway, RD Web, RD Broker connectivity
- Azure AD and authentication endpoints
- Windows activation services (KMS)
- Geneva agent and monitoring endpoints
- FSLogix profile container storage
When an endpoint becomes unreachable, you’ll know about it before users start experiencing issues.
2. Network Change Validation
After firewall or proxy changes, run the monitor to immediately verify all AVD endpoints are still accessible. The dashboard shows you exactly which endpoints are blocked and which are working.
3. End-User Troubleshooting
Deploy the portable version on client devices when users report connectivity problems. The real-time latency graphs help identify whether the issue is network-related or something else entirely.
4. Golden Image Validation
Include in your VDI golden image build process. Before sealing the image, verify all required endpoints are reachable from the base configuration.
Features
Endpoint Monitoring
The app tests connectivity using TCP, HTTP, and HTTPS protocols with automatic fallback:
| Protocol | Default Port | Use Case |
|---|---|---|
| TCP | Various | Direct connection testing (RD Gateway 443, etc.) |
| HTTP | 80 | Certificate servers, activation endpoints |
| HTTPS | 443 | Most AVD services, authentication endpoints |
Wildcard domains like *.wvd.microsoft.com are automatically expanded to test all subdomains (rdgateway, rdweb, client, rdbroker).
FSLogix Storage Monitoring
On session hosts, the app automatically detects FSLogix storage paths from the Windows Registry and monitors SMB connectivity (port 445):
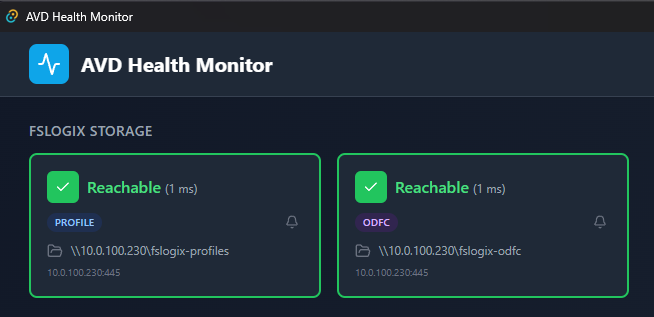
This catches storage connectivity issues that would otherwise result in failed user logins or temporary profile creation.
Smart Alerting
Nobody wants notification spam. The alerting system uses configurable thresholds:
| Setting | Default | Purpose |
|---|---|---|
| Consecutive Threshold | 3 failures | Prevents alerts on transient network blips |
| Alert Cooldown | 5 minutes | Minimum time between repeated alerts |
| Per-Endpoint Muting | Available | Suppress alerts for known-noisy endpoints |
Latency Tracking
The dashboard shows 24-hour latency history with min/max/average statistics per endpoint. Useful for identifying patterns—like that firewall that gets overloaded every day at 9 AM when everyone logs in.
Configuration
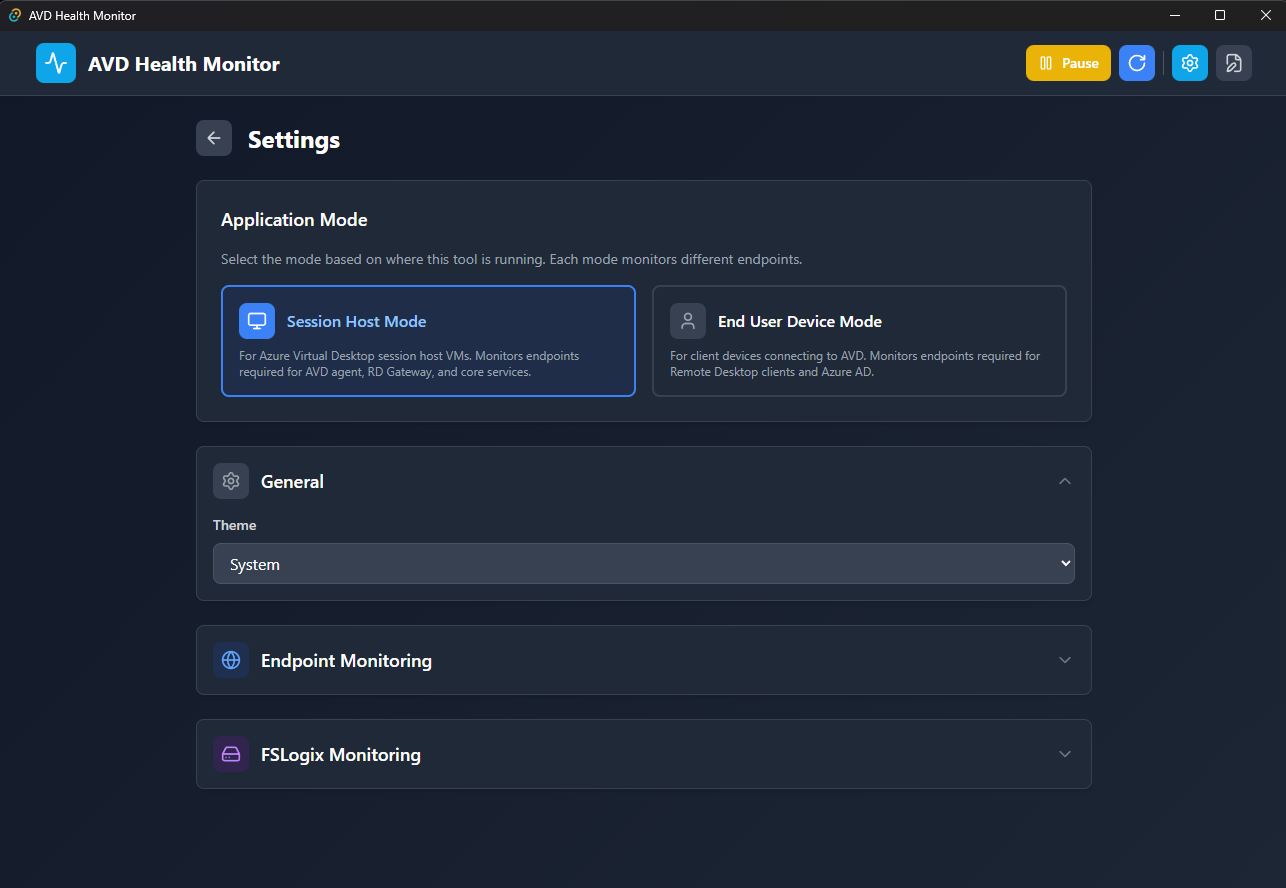
Application Mode
Switch between Session Host and End User Device modes depending on where the app is running:
| Mode | Endpoints Tested |
|---|---|
| Session Host | Full endpoint set including agent communication, activation, monitoring, FSLogix |
| End User Device | Client-focused endpoints: gateway, authentication, core AVD services |
Endpoint Configuration
Configure test intervals, latency thresholds, and add custom endpoints:
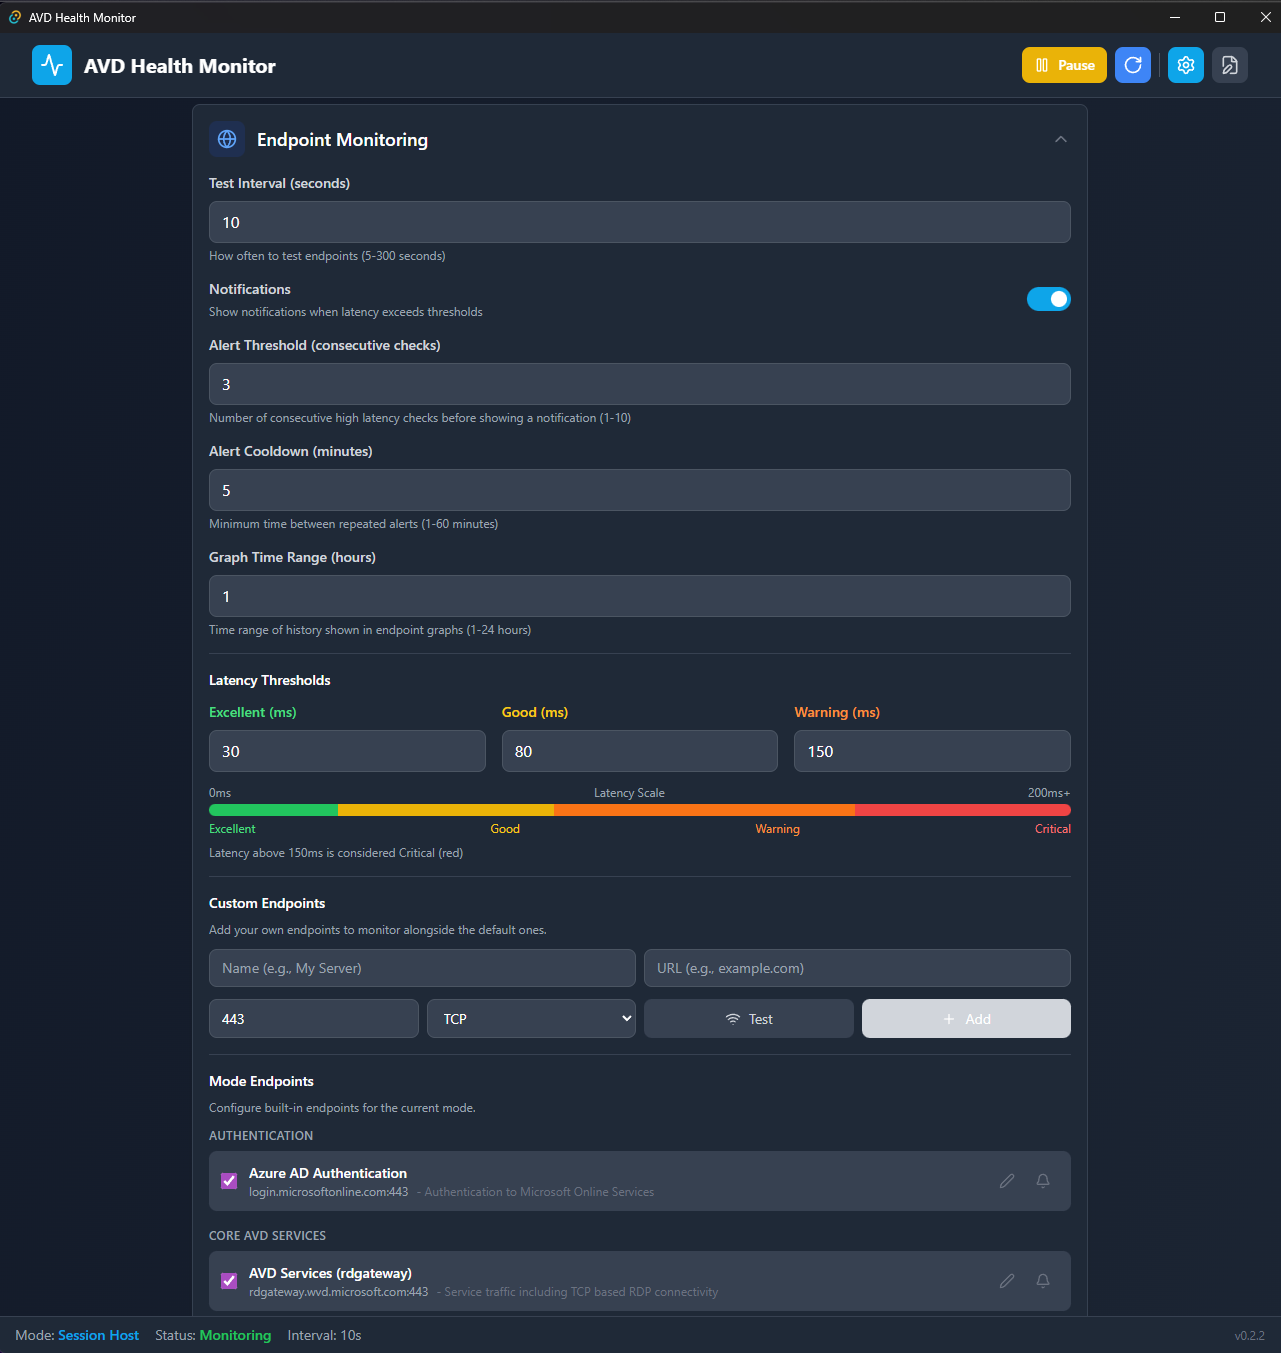
| Setting | Default | Range |
|---|---|---|
| Test Interval | 60 seconds | 5-300 seconds |
| Excellent Latency | 0-50ms | Configurable |
| Good Latency | 51-100ms | Configurable |
| Warning Latency | 101-150ms | Configurable |
| Critical Latency | >150ms | Configurable |
💡 Note: You can add custom endpoints alongside the defaults. Useful if you have internal services that need monitoring or region-specific endpoints.
FSLogix Settings
Configure FSLogix-specific monitoring parameters:
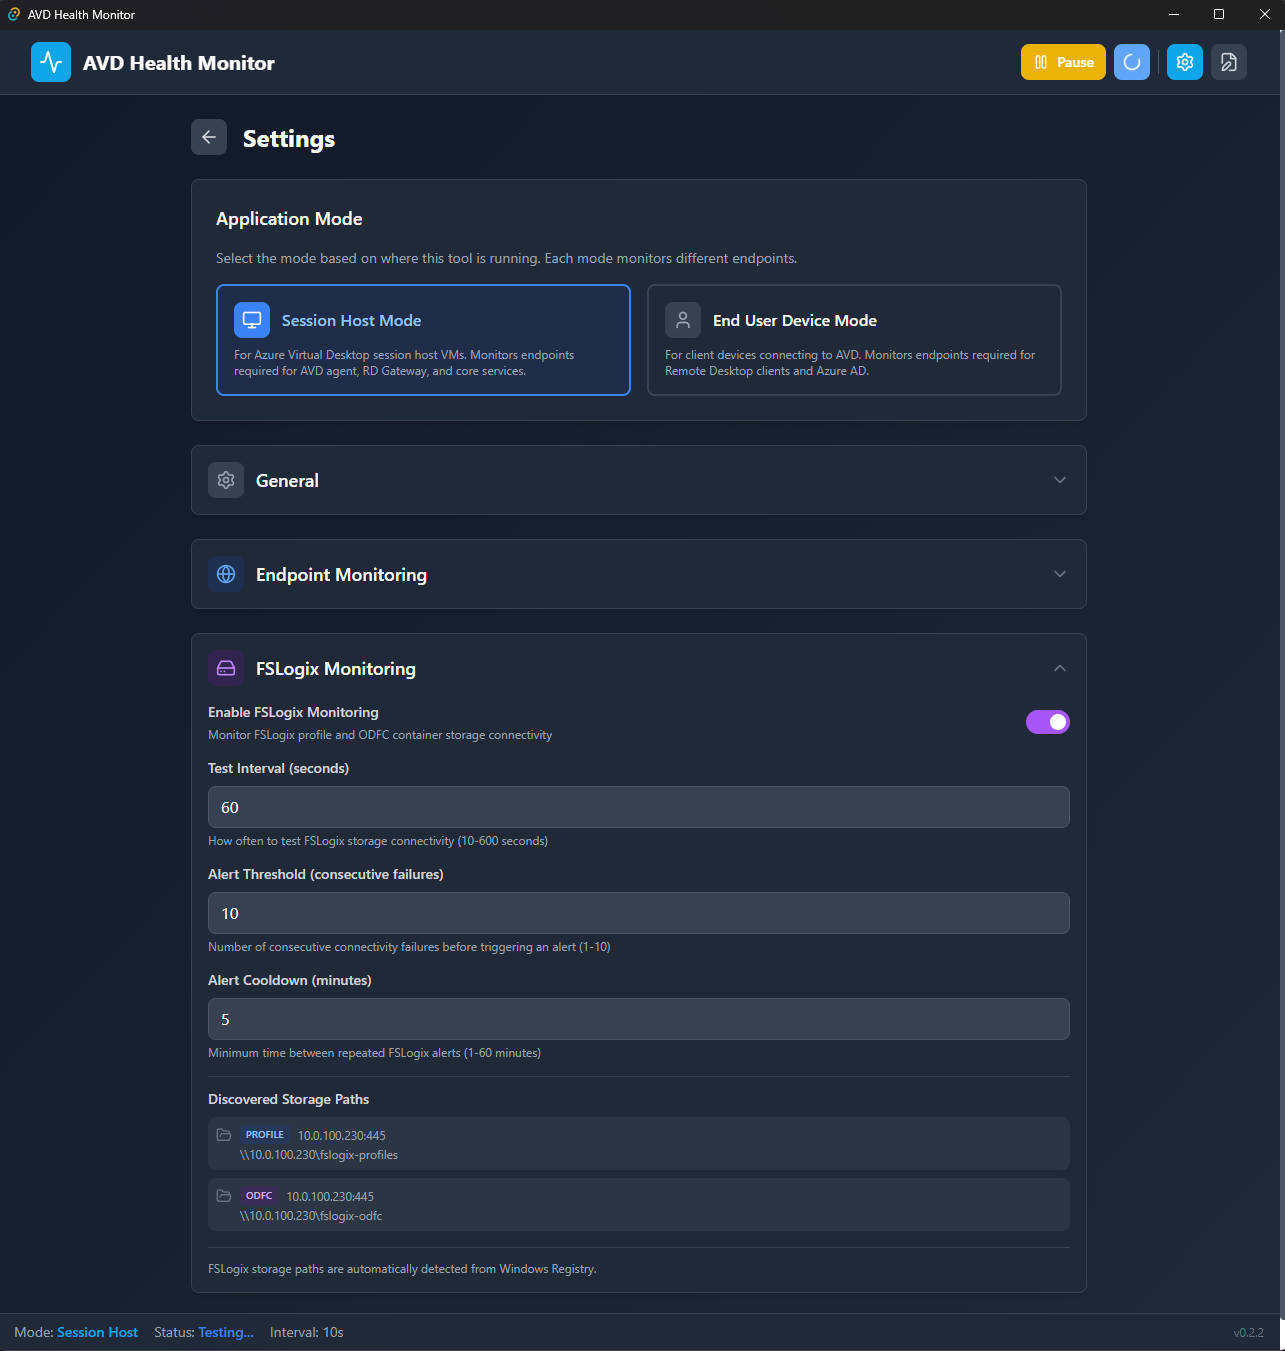
Storage paths are auto-detected from the Windows Registry—no manual configuration needed in most cases.
Configuration Files
All settings are stored in JSON files under %APPDATA%\AVDHealthMonitor\:
%APPDATA%\AVDHealthMonitor\
├── settings.json                    # Application config + custom endpoints
├── sessionhost-endpoints.json       # Session host endpoint definitions
└── enduser-endpoints.json           # End-user device endpoints
You can edit these directly if you prefer config files over the UI. Portable mode stores files next to the executable instead.
Configuration File Reference
settings.json
The main configuration file. Contains application settings and custom endpoints.
{
  "version": 1,
  "config": {
    "mode": "sessionhost",
    "testInterval": 60,
    "retentionDays": 30,
    "thresholds": {
      "excellent": 50,
      "good": 100,
      "warning": 150
    },
    "notificationsEnabled": true,
    "autoStart": false,
    "theme": "system",
    "alertThreshold": 3,
    "alertCooldown": 5,
    "graphTimeRange": 1,
    "fslogixEnabled": true,
    "fslogixTestInterval": 60,
    "fslogixAlertThreshold": 3,
    "fslogixAlertCooldown": 5
  },
  "customEndpoints": [],
  "fslogixPathStates": []
}
Config Properties
| Property | Type | Default | Description |
|---|---|---|---|
mode | string | sessionhost | Application mode: sessionhost or enduser |
testInterval | integer | 60 | Seconds between endpoint tests (5-300) |
retentionDays | integer | 30 | Days to keep latency history |
thresholds.excellent | integer | 50 | Max latency (ms) for excellent status |
thresholds.good | integer | 100 | Max latency (ms) for good status |
thresholds.warning | integer | 150 | Max latency (ms) for warning status |
notificationsEnabled | boolean | true | Enable Windows toast notifications |
autoStart | boolean | false | Start app on Windows boot |
theme | string | system | UI theme: light, dark, or system |
alertThreshold | integer | 3 | Consecutive failures before alerting |
alertCooldown | integer | 5 | Minutes between repeated alerts |
graphTimeRange | integer | 1 | Hours of history shown in graphs (1-24) |
fslogixEnabled | boolean | true | Enable FSLogix storage monitoring |
fslogixTestInterval | integer | 60 | Seconds between FSLogix tests |
fslogixAlertThreshold | integer | 3 | Consecutive FSLogix failures before alerting |
fslogixAlertCooldown | integer | 5 | Minutes between FSLogix alerts |
Custom Endpoints
Add your own endpoints to monitor alongside the defaults:
{
  "customEndpoints": [
    {
      "id": "custom-internal-proxy",
      "name": "Internal Proxy",
      "url": "proxy.corp.local",
      "port": 8080,
      "protocol": "tcp",
      "category": "Custom",
      "enabled": true,
      "latencyCritical": true
    },
    {
      "id": "custom-file-share",
      "name": "Profile Storage",
      "url": "fileserver.corp.local",
      "port": 445,
      "protocol": "tcp",
      "category": "Custom",
      "enabled": true,
      "latencyCritical": false
    }
  ]
}
| Property | Type | Required | Description |
|---|---|---|---|
id | string | yes | Unique identifier (no spaces) |
name | string | yes | Display name in dashboard |
url | string | yes | Hostname or IP to test |
port | integer | no | Port number (default: 443) |
protocol | string | no | tcp, http, or https (default: tcp) |
category | string | no | Category grouping (default: Custom) |
enabled | boolean | no | Enable/disable testing (default: true) |
latencyCritical | boolean | no | Include in latency calculations (default: true) |
FSLogix Path States
Track muted status for auto-detected FSLogix paths:
{
  "fslogixPathStates": [
    {
      "id": "fslogix-profile-0",
      "muted": true
    }
  ]
}
sessionhost-endpoints.json / enduser-endpoints.json
Endpoint definition files. Each mode has its own file with categories and endpoints.
{
  "name": "Session Host",
  "description": "Endpoints required for Azure Virtual Desktop session host VMs",
  "source": "https://learn.microsoft.com/en-us/azure/virtual-desktop/required-fqdn-endpoint",
  "categories": [
    {
      "name": "Authentication",
      "description": "Authentication and identity endpoints",
      "endpoints": [
        {
          "id": "sh-azure-login",
          "name": "Azure AD Authentication",
          "url": "login.microsoftonline.com",
          "port": 443,
          "protocol": "tcp",
          "required": true,
          "purpose": "Authentication to Microsoft Online Services",
          "latencyCritical": true,
          "muted": false
        }
      ]
    },
    {
      "name": "Core AVD Services",
      "description": "Essential endpoints for AVD functionality",
      "endpoints": [
        {
          "id": "sh-avd-services",
          "name": "AVD Services",
          "url": "*.wvd.microsoft.com",
          "port": 443,
          "protocol": "tcp",
          "required": true,
          "purpose": "Service traffic including TCP based RDP connectivity",
          "latencyCritical": true,
          "muted": false,
          "wildcardPattern": "*.wvd.microsoft.com",
          "knownSubdomains": ["rdgateway", "rdweb", "client", "rdbroker"]
        }
      ]
    }
  ]
}
Endpoint Properties
| Property | Type | Description |
|---|---|---|
id | string | Unique identifier |
name | string | Display name |
url | string | Hostname, IP, or wildcard pattern |
port | integer | Port number |
protocol | string | tcp, http, or https |
required | boolean | Microsoft-required endpoint |
purpose | string | Description of what it’s used for |
latencyCritical | boolean | Include in latency status calculations |
muted | boolean | Suppress alerts for this endpoint |
enabled | boolean | Enable/disable testing |
wildcardPattern | string | Pattern like *.wvd.microsoft.com |
knownSubdomains | array | Subdomains to expand wildcard into |
Wildcard Expansion
Endpoints with wildcardPattern and knownSubdomains are automatically expanded. This:
{
  "url": "*.wvd.microsoft.com",
  "wildcardPattern": "*.wvd.microsoft.com",
  "knownSubdomains": ["rdgateway", "rdweb", "client", "rdbroker"]
}
Becomes four separate endpoint tests:
rdgateway.wvd.microsoft.comrdweb.wvd.microsoft.comclient.wvd.microsoft.comrdbroker.wvd.microsoft.com
💡 Tip: You can add additional subdomains to the
knownSubdomainsarray if you need to test region-specific endpoints likerdgateway-eu.wvd.microsoft.com.
Deployment Options
Winget (Recommended)
The easiest way to install—one command and you’re done:
winget install seb07-cloud.AVDHealthMonitor
Updates are handled automatically via winget:
winget upgrade seb07-cloud.AVDHealthMonitor
MSI Installer
Download AVD.Health.Monitor_<version>_x64_en-US.msi from the releases page. Provides Start Menu shortcuts, desktop icon, and proper Windows Registry entries.
Useful when you need to deploy via SCCM, Intune, or other software distribution tools.
Portable Executable
Download the portable .exe for a standalone executable that runs without installation. Useful for:
- Quick troubleshooting sessions
- USB deployment
- Environments where MSI installation isn’t allowed
System Requirements (all methods):
- Windows 10 (build 1809+) or Windows 11
- WebView2 runtime (pre-installed on Win11, auto-installs on Win10)
- ~15MB disk space
Auto-Start Configuration
Enable auto-start in settings to launch the app automatically on Windows boot. The app runs minimized in the system tray—users won’t notice it unless there’s a problem.
⚠️ Important: When deploying to production session hosts, consider the additional (minimal) resource usage: ~50MB RAM per instance.
Monitored Endpoints
The app monitors all Microsoft-documented required endpoints for AVD. Here’s a subset of what’s tested:
Core AVD Services
| Endpoint | Purpose |
|---|---|
*.wvd.microsoft.com | RD Gateway, Web, Broker, Client |
login.microsoftonline.com | Azure AD authentication |
login.windows.net | Azure AD authentication |
catalogartifact.azureedge.net | Azure Marketplace images |
Agent & Updates
| Endpoint | Purpose |
|---|---|
mrsglobalsteus2prod.blob.core.windows.net | Agent updates |
wvdportalstorageblob.blob.core.windows.net | Portal storage |
Monitoring & Telemetry
| Endpoint | Purpose |
|---|---|
gcs.prod.monitoring.core.windows.net | Geneva monitoring |
global.azure-devices-provisioning.net | Device provisioning |
Windows Activation
| Endpoint | Purpose |
|---|---|
kms.core.windows.net | KMS activation |
azkms.core.windows.net | Azure KMS |
💡 Good to know: The full endpoint list is maintained in the endpoint JSON files. You can review and customize these based on your specific AVD configuration.
Logging
Logs are stored in JSON Lines format under %APPDATA%\AVDHealthMonitor\logs\:
{"timestamp":"2026-01-07T10:30:45+00:00","endpoint":"rdgateway.wvd.microsoft.com","latency_ms":25.4,"status":"excellent"}
{"timestamp":"2026-01-07T10:30:45+00:00","endpoint":"login.microsoftonline.com","latency_ms":42.1,"status":"excellent"}
Useful for historical analysis or feeding into your existing log aggregation pipeline.
Links and References
- GitHub Repository - Source code and releases
- AVD Required URLs - Microsoft documentation on required endpoints
- FSLogix Documentation - FSLogix overview and configuration
- AVD Network Guidelines - Network connectivity requirements for AVD